The buying decision version - numbers + lived reality + the actual trade-off.
Category
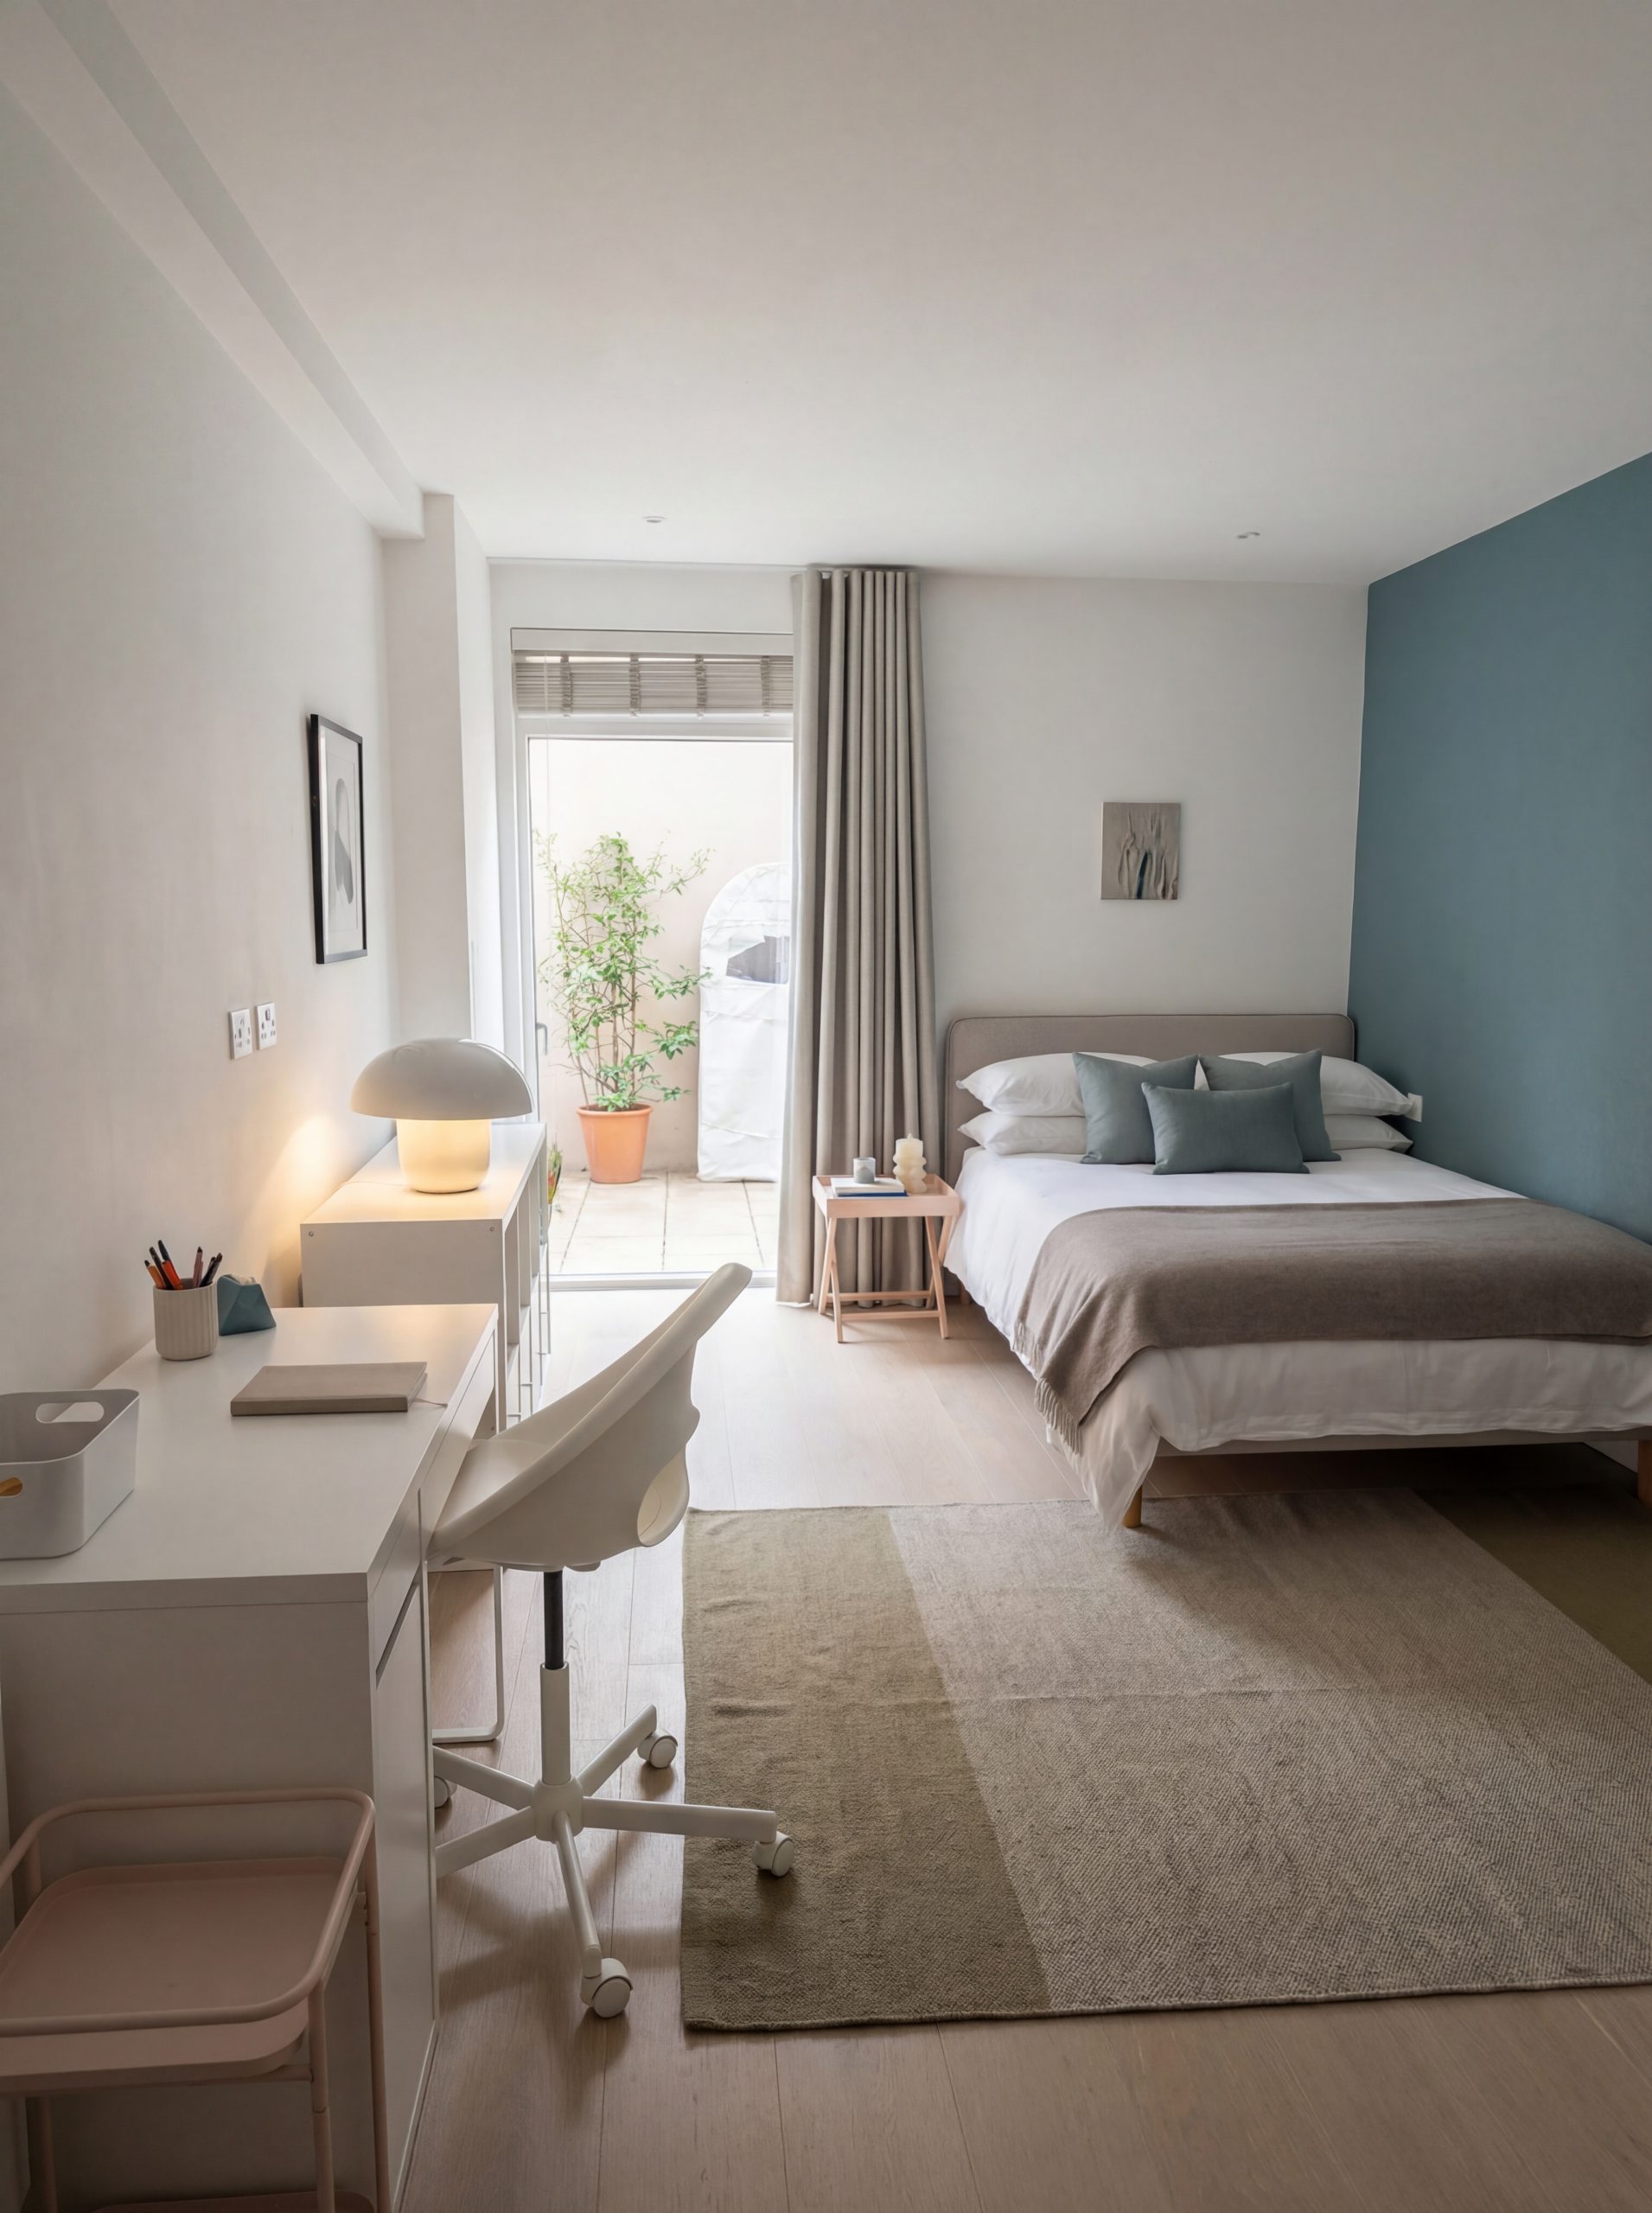
Maida Vale
Queen's Park
The Trade Off
Average sold price (latest) + 12-month change
Local price sample for Maida Vale: ~£800,000–£870,000 over the last year (property portal listings). Flats ~£713,987; terraces ~£1,413,425 (Zoopla Rightmove samples)
Borough proxy (Brent) average £543,000 (ONS, Nov 2025). Brent prices remain down year-on-year. (borough average, not geo-precise).
Queen’s Park averages lower at borough-level; Maida Vale’s portal figures are significantly higher — reflecting Westminster pricing and dominant mansion-block stock. Portal figures aren’t official stats but give buyer context.
By property type (borough context)
Maida Vale samples: flats ~£727,027; terraces ~£1,359,935; semi-detached and larger structurally very high
Brent borough (proxy) breakdown shows flats lower than houses (ONS).
Maida Vale shows higher absolute values for all types in portal samples; Queen’s Park’s borough proxy signals a lower overall average. Exact neighbourhood breakdowns require estate agent comps.
Property type mix (ward, Census 2021)
Maida Vale mostly mansion flats and apartments with a fair number of conversions; terraces exist but are rarer compared to flats. Census/ward profile confirms flats dominate
Queen’s Park ward (Brent) is a mixed area with flats and houses; Brent ward data shows urban mix, but exact proportions at ward level require local dataset download.
Queen’s Park provides more diversity of stock including houses and terraces; Maida Vale is heavier on flats and mansion blocks. Buyers seeking terrace/houses may find Queen’s Park comparatively broader stock.
Tenure mix (ward, Census 2021)
Maida Vale ward had a mix of ownership and private renting in the past census, with flats predominant; exact up-to-date tenure mix at ward level requires local census download
Queen’s Park (Brent ward) tenure is mixed (owner-occupier + private rent + social rent). Brent borough has diverse tenure patterns
Both areas have mixed tenure, but Maida Vale is an inner city, flats-heavy area with balanced owner/renter mix historically; Queen’s Park’s Brent ward tenure also mixed. Specific proportions will vary by street and stock type.
Rental market snapshot (borough, ONS) + caveat
Portal data for Maida Vale tends to indicate relatively high rents due to large flats; specific portal ranges often £700 – £1,500 pw
Local sample rental range reported around £1,926/month (Brent average falls seen); portal data for Queen’s Park indicates ~£822–£824 pw typical
Queen’s Park rents appear strong (portal rental listings), in line with borough. Maida Vale rents are high on listings, reflecting high property values. Use portal ranges as indicative, not official.
Transport pattern (what you actually buy)
Served by Maida Vale station (Bakerloo line) (plus local bus routes).
Served by Queen’s Park (Bakerloo + London Overground Watford DC).
Maida Vale = simpler Bakerloo access; Queen’s Park = Bakerloo + Overground options.
Schools (brief, data-led)
Maida Vale ward has local primary and secondary schools listed in ward profile (e.g., Essendine Primary, St Augustine’s)
Local access to schools within Brent/Westminster areas; Ward profiles list community amenities.
Both areas serve families; Queen’s Park often recognised for park-centric family life, Maida Vale has local schools within the Westminster context.
Safety / crime (careful, official framing)
Maida Vale ward’s crime rate ~93.4 per 1,000 residents, significantly lower than Westminster average.
Queen’s Park ward (Brent) crime rate is ~110–120 offences per 1,000 residents (latest rolling year), lower than the Brent borough average and broadly mid-range in a London context.
Maida Vale shows relatively low ward crime rates; Queen’s Park borough/ward data should be checked via Met Police breakdown for micro-differences. Serves as contextual layer, not fatal metric.
Parks / amenities + neighbourhood vibe (labelled subjective)
Maida Vale has canal pathways, open green spaces, and inner-city residential amenities
Queen’s Park itself is a major green amenity and social anchor .
Queen’s Park is more park-led in daily life; Maida Vale offers canals, green pockets but less central to community events.
Investment profile (risk/volatility signals; evidence-led where possible)
Maida Vale portal pricing shows higher absolute levels with falls reported on some metrics; central Westminster pricing often more volatile in downturns.
Brent borough pricing and rent data show recent declines and variability; Queen’s Park sits within that context
Maida Vale higher entry prices with potential price volatility at peak markets; Queen’s Park borough signal is lower average but subject to Brent market conditions.